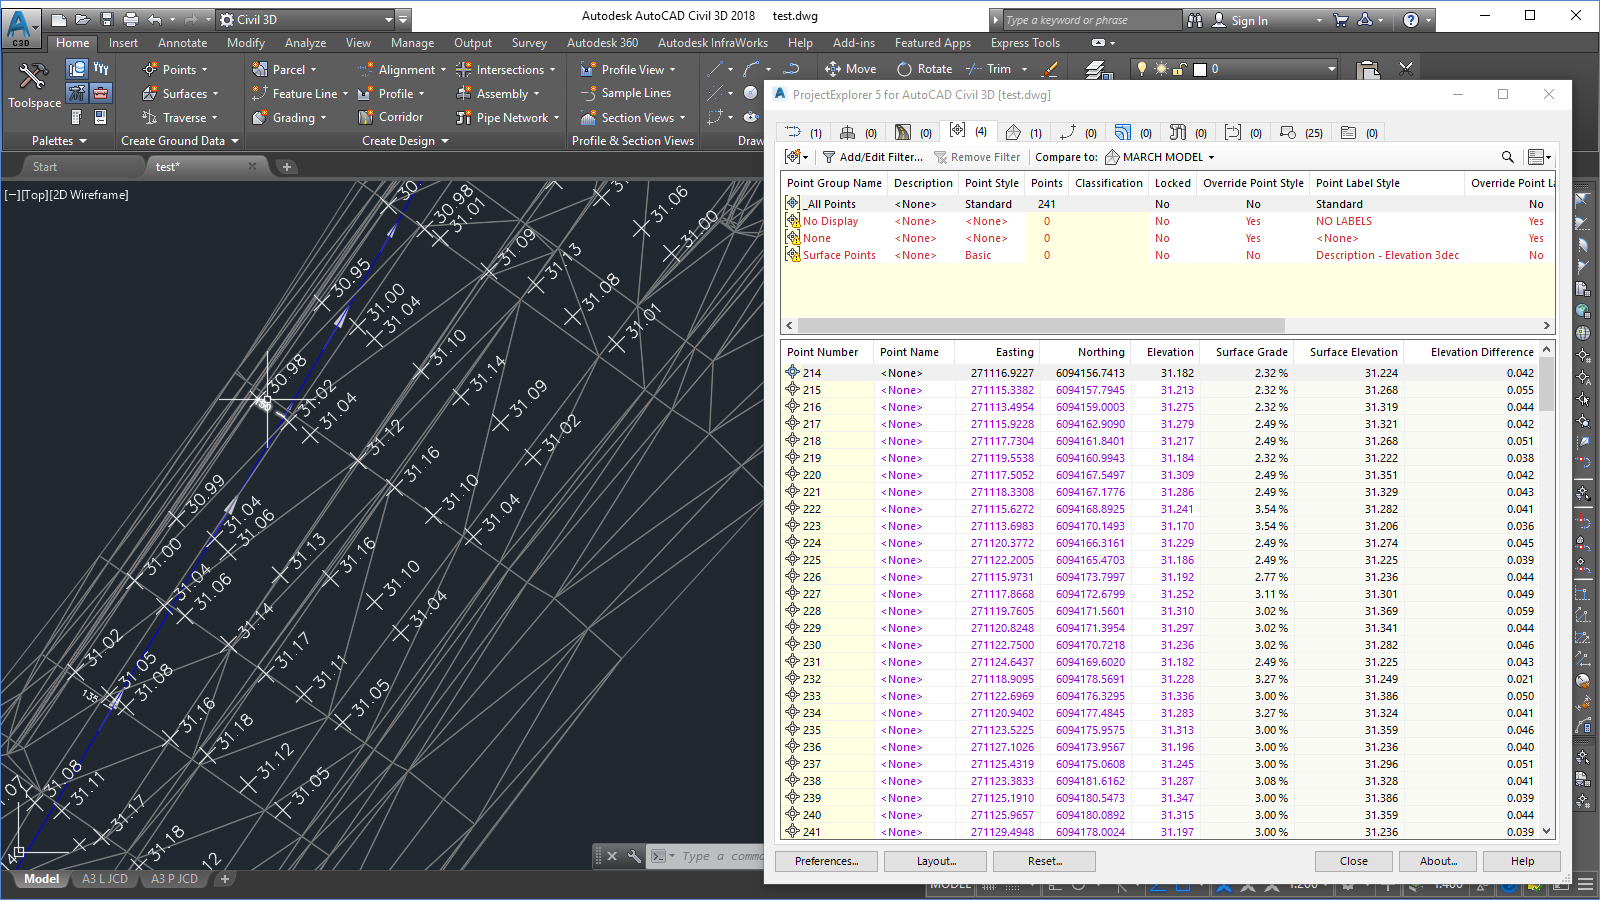
In this post, I’ll be focussing on the new dynamic reporting tools in ProjectExplorer 5 which allow you to dynamically monitor the relationship between two Civil 3D objects. These tools support a range of object comparisons, but on this occasion, I want to concentrate on the following question which was posted to the Autodesk Knowledge Network forums recently.
I have a TIN surface and a load of COGO points located at various points on the surface. I’d like to extract the one-point grade of the surface at each of these points. However, as there are a lot of points, I can’t really do this manually, and the surface is likely to change frequently. This needs to be ideally to a table in Civil 3D, or to a csv file, not as labels on the surface. Is there a way to do this dynamically?
This is the kind of thing that ProjectExplorer is particularly good at – particularly that part about the surface being likely to change frequently.
So, there are two stages to this process. First of all, we need to preview the comparison in the ProjectExplorer window. Secondly, we need to set up an Object Set to handle the export of the comparison to Excel. The use of an Object Set is crucial for this process because once set up we will be able to repeatedly update the exported spreadsheet whenever we apply changes to the surface or points in Civil 3D.
Previewing the comparison in the ProjectExplorer window
Previewing the comparison in the ProjectExplorer window is easy. We need to navigate to the Point Groups tab in the ProjectExplorer window and select the point group which holds the XY points that we want to compare against the surface geometry. Then in the toolbar at the top of the window, we open the “Compare to” drop-down menu and select the surface that we want to compare to. That’s the comparison parameters set up, but you might not immediately see any results. So why is that?
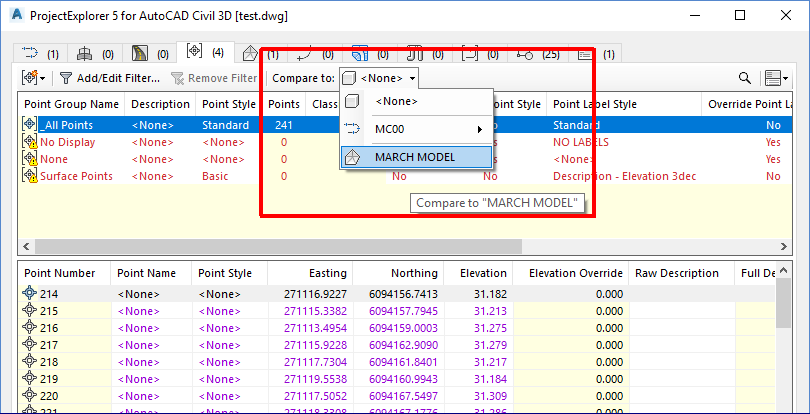
At this point, if you are using the standard layout style in the ProjectExplorer window, the columns which have been populated with the compared values for each point will be way over on the right. It’s likely that you’ll need to scroll across to the last few columns to see the surface elevation, slope and elevation difference values. Because of the type of comparison we are doing here, it would be a good idea to hide any COGO point data columns that don’t relate to the parameters that we need to review. To do this, click the Layout button in the lower left corner of the ProjectExplorer window to open the Layout Options window.
In the Layout Options window, navigate to the Point Groups tab and change the drop-down list to Set Column Layout for Cogo Points.
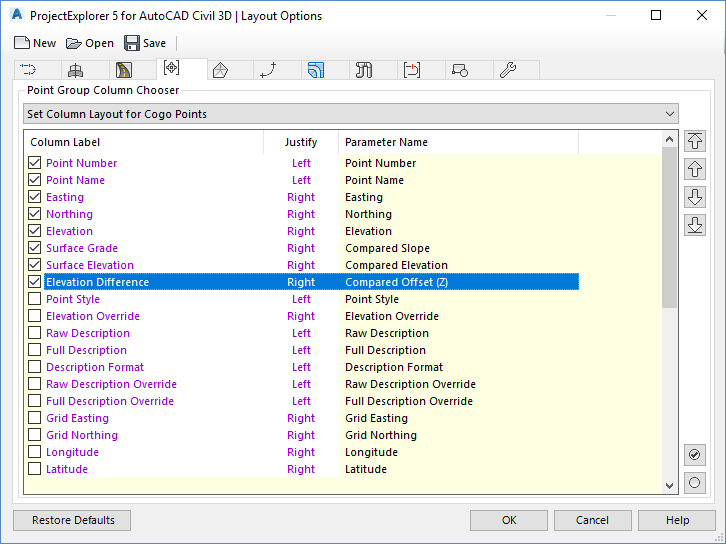
Next, deactivate every Cogo Point data column, except for Point Number, Point Name, Easting, Northing, Elevation, Compared Z, Compared Offset Z, and Compared Slope. You may wish to reorder or relabel these columns at this point. Once you have done this, you might want to save these settings to a Layout Style for re-use later.
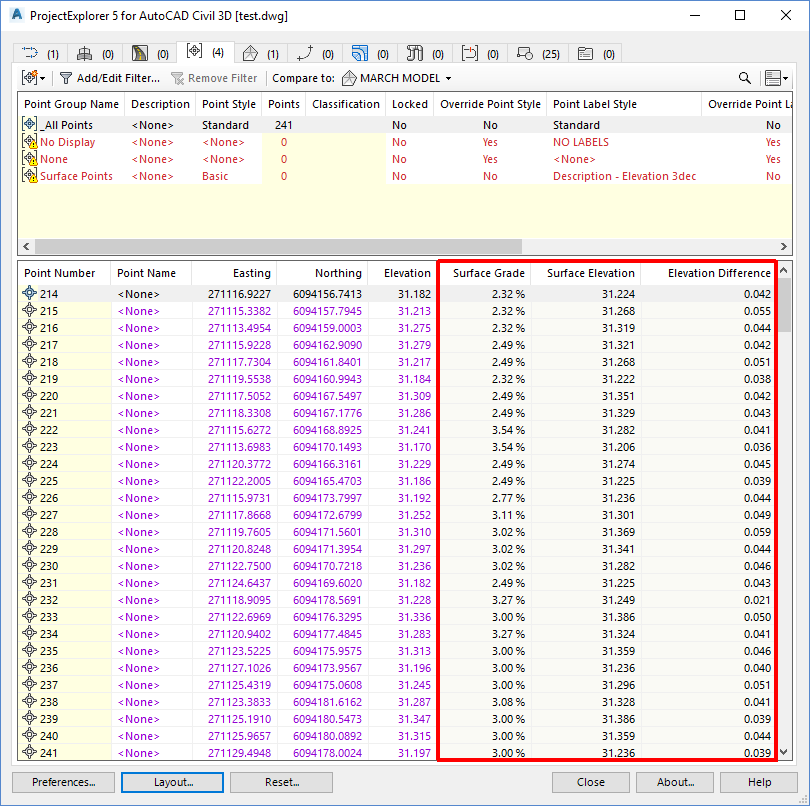
When you close the Layout Options window, the ProjectExplorer window will be populated with the new column layout and it is now much easier to review the comparison results.
What about design changes?
At this point, the benefits of using ProjectExplorer really come into play. Any changes to the surface or point group geometry will cause the ProjectExplorer window to be refreshed with the latest comparison results. So incorporating design changes into these results couldn’t be easier.
Exporting the results to Excel
Previewing this information in the ProjectExplorer is great for monitoring the relationship between two elements in your model whilst you make changes to your design, but at some point you’ll want to export the information elsewhere. In fact, if you continue to make changes to your design, it is very likely that you’ll want to repeatedly export this information to an external file. In this scenario of course, it’s crucial that we can run the export with as few steps as possible. This is where Object Sets come in.
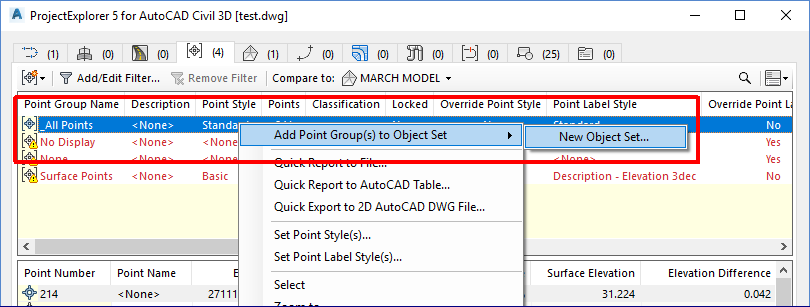
Right-click the point group to create a new Object Set, then in the Object Set parameters window choose the type of file and the output path you’d like to export the results to. For now, set the Layout Style set to Use Layout of ProjectExporer window, and set the Report Style to Use Default Report Style for Object Sets. Once you have closed this panel, select the Object Sets tab in the ProjectExplorer window to see the Point Group listed under your new Object Set definition with the comparison we’ve set up still intact in the Object Set entry.
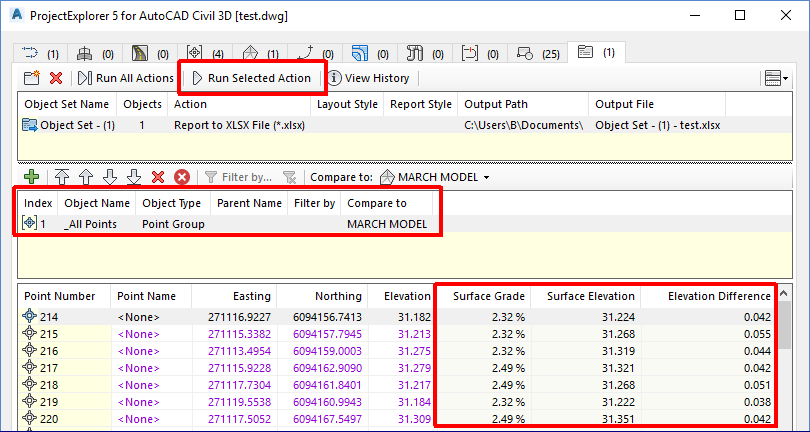
Now that we have set up our Object Set, we can generate or update the exported file with a single click of the Run Selected Action button. The Object Set is saved persistently in the drawing, so we can come back to this tab and monitor the comparison or export or update the report at any time.
The video
So, finally – here’s the full solution to this problem in the form of a YouTube video. This video takes you through the entire process in the space of about 3 minutes. Enjoy!