ProjectExplorer 5 for Autodesk Civil 3D
Tutorials | Working with Object Sets
Tutorials
Working with Object Sets
This tutorial demonstrates the use of Object Sets in ProjectExplorer to simultaneously generate two broadly identical reports to a Microsoft Word DOCX file and a Microsoft Excel XLSX file. The use of object sets will allow us to easily ensure that the content of both files is kept in-sync - even after a design change.
Object Sets allow complex reports to be generated, featuring a range of content from a Civil 3D model. In this example, the report will include a pipe run between two specific structures on a pipe network, and a station based report of the channel lines on a corridor.
Getting Started
In Autodesk Civil 3D, Open the standard Civil 3D sample drawing: Intro-1.dwg
This drawing is part of the standard Civil 3D installation, and can generally be found in the following folder:
C:\Program Files\Autodesk\AutoCAD 2018\C3D\Help\Civil Tutorials\
About Object Sets
Object Sets allow us to nominate a selection of objects in a Civil 3D drawing. Object Sets are persistently remembered in each AutoCAD drawing.
Crucially, Object Sets can have optional actions associated with them. Actions are generally configured to generate report files or to export data files. Filters can be applied to certain types of objects in an object set to (for instance):
- Compare an alignment with another alignment in terms of offset/elevation/crossfall on a station by station basis.
- Nominate a start and end structure to produce a pipe run report.
- Nominate a comparison surface to show pipe depths at regular intervals in a pipe run report.
- Nominate specific point codes to restrict the types of feature line included in a corridor report.
Creating our first Object Set
- From the Civil 3D ribbon, select the Add-Ins tab and open the ProjectExplorer window.
- Select the Object Sets tab in the ProjectExplorer window, then press the New Object Set button on the toolbar to start creating your first object set in the current drawing.
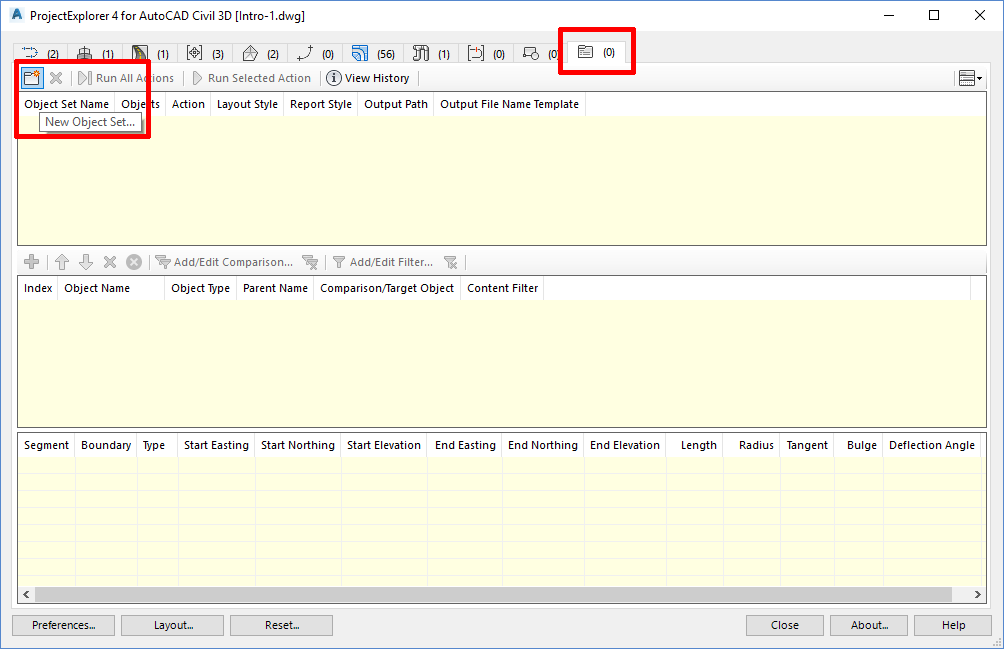
The Create Object Set dialog opens.
Configuring the Object Set
To define an object set which generates a report, we need to nominate a file name, file type and output path for the report, then configure the content and layout of the report using a Layout Style and a Report Style.
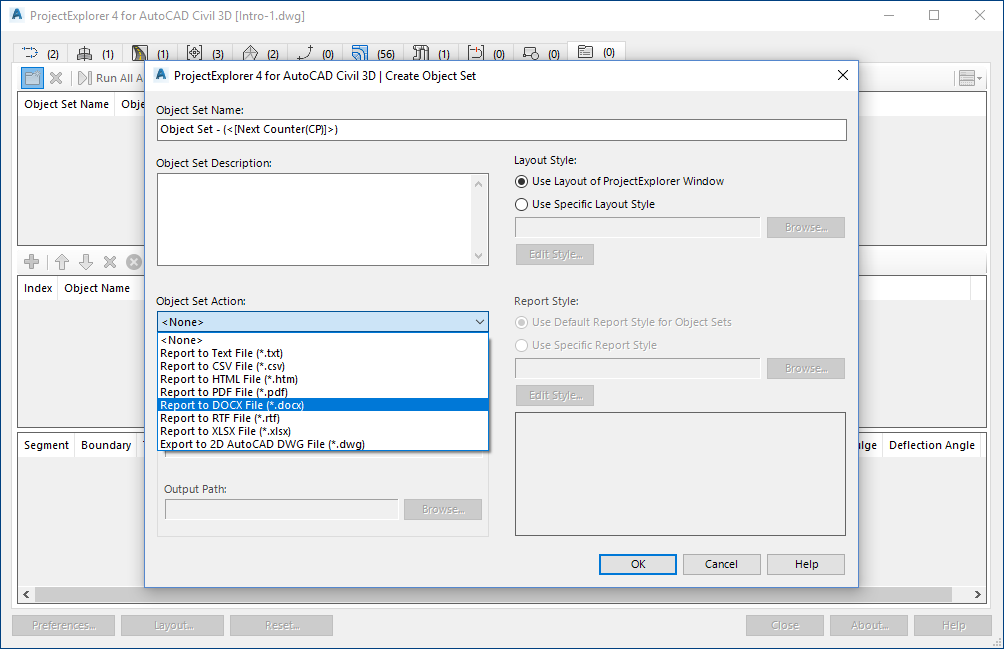
- Select Report to DOCX File from the Action drop down list.
- Note that the file name of the outgoing report file can be derived from a series of dynamic variables, or you can specify a fixed file name in this dialog. In this case, we'll use the default option - the outgoing file name will be made up of a combination of the object set name and the drawing name.
- Set the required Output Path if desired.
- Change the Layout Style setting to Use Specific Layout Style, then press the Edit button to start defining the layout of this report.
The Layout Options dialog opens.
Layout Style Options
Layout Styles define the heading, visibility, and order of every column of data in the report. The units of numerical values can also be controlled from a layout style.
From this dialog we will define the layout style which will be applied to the outgoing report. Most importantly, we want to disable some data columns from our report to avoid the output from becoming too crowded on the page.
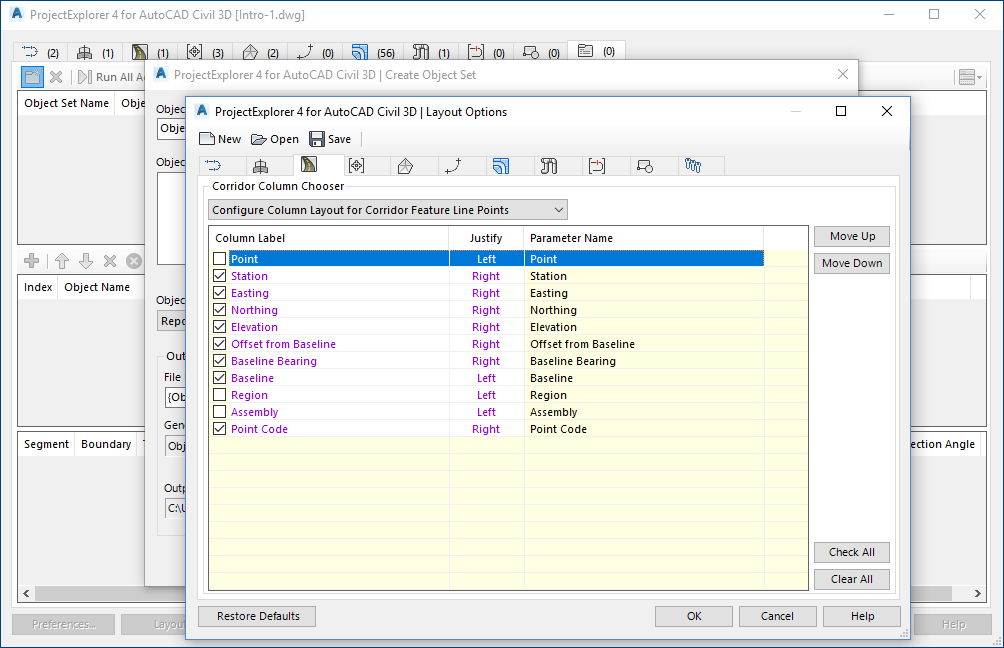
- In the Corridors tab of the Layout Options dialog, ensure that Configure Column Layout for Corridor Feature Line Points is selected.
- From the list view, uncheck the following column labels:
- Point
- Region
- Assembly
- In the Pipe Networks tab of the Layout Options dialog, ensure that Configure Column Layout for Pipe Networks is selected.
- From the list view, uncheck the following column labels:
- Structure Plan Label Style
- Pipe Plan Label Style
- Structure Plan LayerPipe Plan Layer
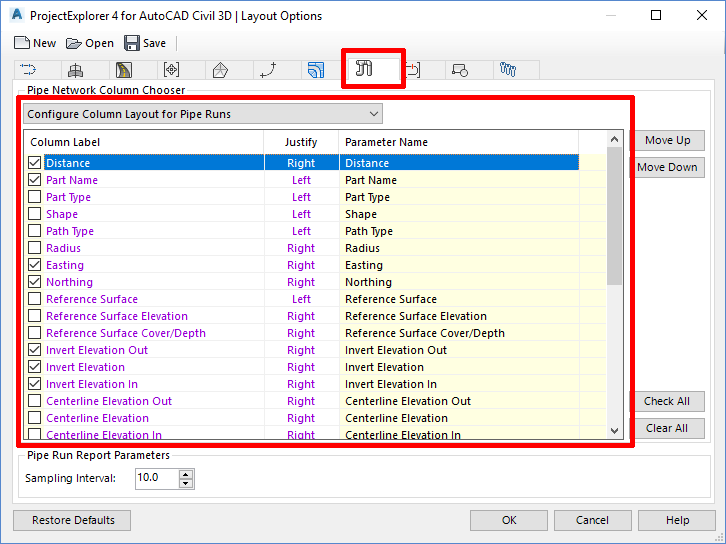
- Change the drop-down list to Configure Column Layout for Pipe Runs.
- From the list view, uncheck everything. Then, just re-check the following items:
- Distance
- Part Name
- Easting
- Northing
- Invert Elevation Out
- Invert Elevation
- Invert Elevation In
- Comparison Surface
- Comparison Surface Elevation
- Comparison Surface Cover/Depth
- At this point, you may rename or reorder any of the selected columns to match the standards in your organisation. Columns may be renamed by double-clicking on the required label, or by right-clicking and selecting Rename from the right-click menu.
- Select the General tab and note the options here to set the format of numerical values such as angles/bearings, stations, elevations, and slopes.
- To use a specific layout style with an object set, we need to save these settings to a layout style and associate the resulting file with this object set.
- Press the Save button, and save the layout style to a path and file name of your choice
- Press OK to close the Layout Options dialog and return to the Create Object Set dialog.
Report Style Options
Next, we'll set up a Report Style to determine the page formatting, fonts, table style, and header/footer content of the outgoing report.
In the Create Object Set dialog, under the Report Style section, press the Edit button.
The Report Options dialog opens.
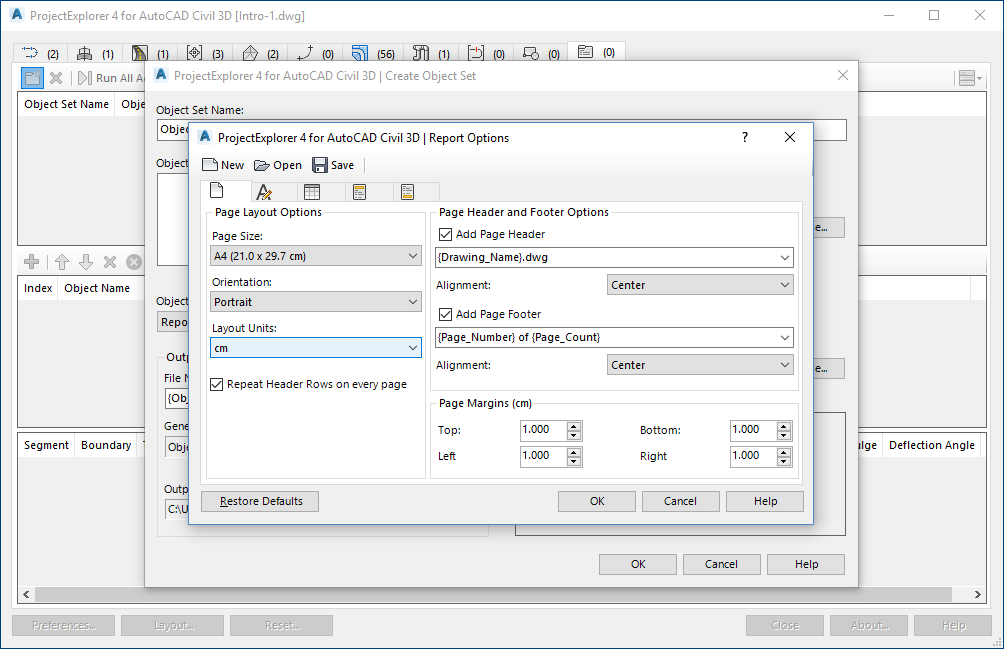
- From the Page Options tab, set the page size to A4, and the page orientation to Portrait.
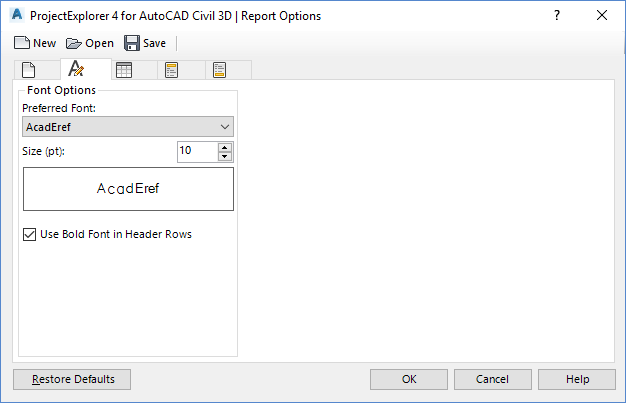
- From the Font Options tab, set the preferred font to Corbel and the font size to 10pt.
- We now need to save these settings to a Report Style and associate the resulting file with this object set. Press the Save button, and save the report style to a path and file name of your choice.
- Press OK to close the Report Options dialog and return to the Create Object Set dialog.
Note that we have now created references in our object set to the layout style and report style that we just defined.
Press OK to close the Create Object Set dialog. We have now completed setting up our first object set.
Let's now populate the object set with some objects.
Populating an Object Set
The objects that we place in our object set will determine the content of our generated report. Let's explore two different ways to add objects to this object set.
To add a corridor from the Object Sets tab
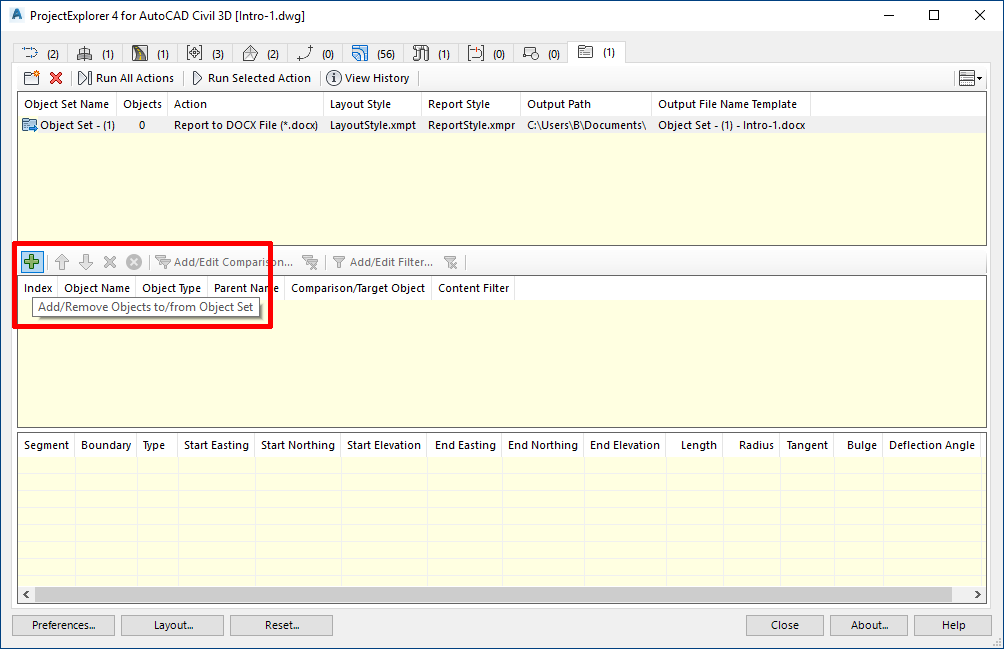
- From the Object Sets tab of the main ProjectExplorer window, press the Add/Remove Object(s) to/from Object Set button.
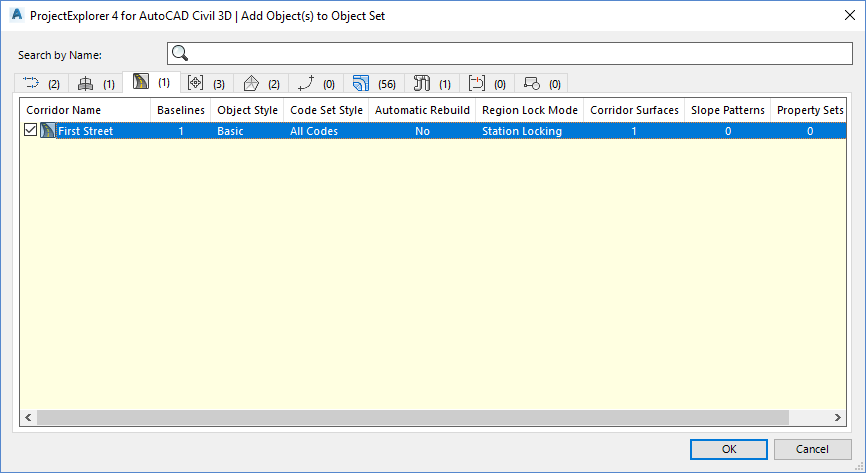
- From the Corridors tab of the resulting dialog, check the First Street corridor and click OK.
- Back in the main ProjectExplorer window we can see that First Street has been added to our Object Set.
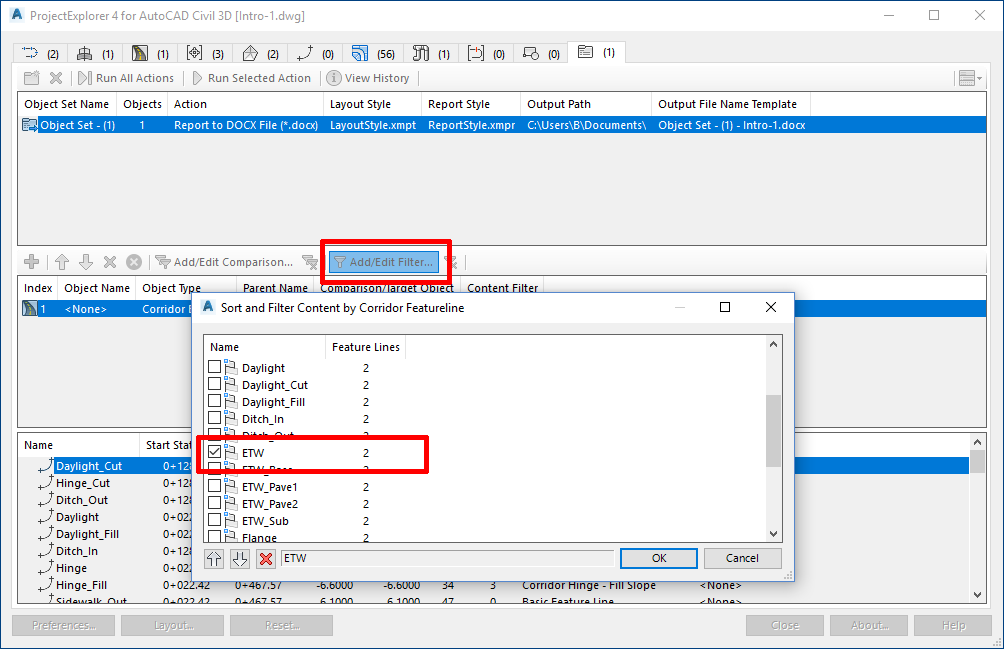
- Optionally, we can now specify the corridor feature lines which we'd like included in our report by adding a point code filter. Press the Add/Edit Filter button to open the Sort and Filter Content dialog. Check the ETW point code and click OK.
To add a pipe run from the Pipe Networks tab
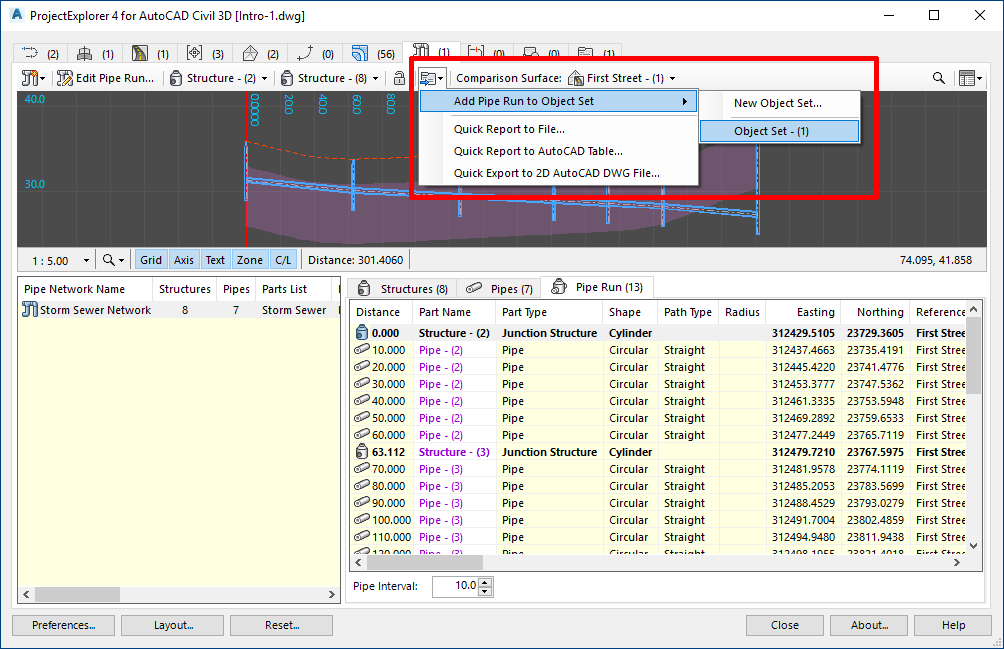
- Open the Pipe Networks tab of the main ProjectExplorer window. From the main toolbar, set the start structure of the Pipe Network profile view to Structure - (2) and the end structure to Structure - (8). This determines the path and route of the displayed pipe run. Set the comparison surface of the pipe run to First Street - (1).
- From the same toolbar press the Report or Export Pipe Run button, and select Object Set - (1) from the Add to Object Set menu. The selected pipe run is added to our object set.
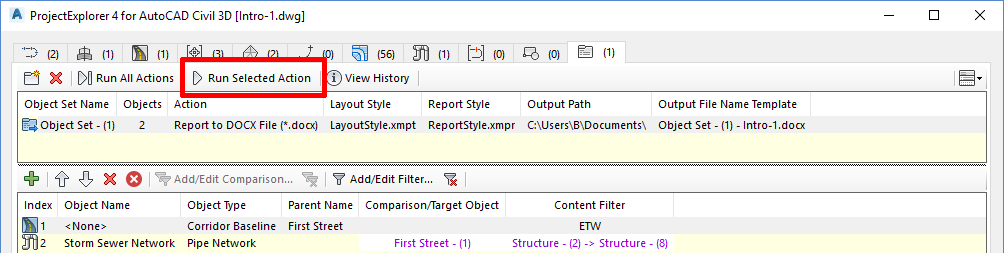
- Return to the Object Sets tab to verify that we now have two objects listed in our object set.
- At this point, we can test the report creation process from our new object set by pressing the Run Selected Action button on the Object Sets tab of the main ProjectExplorer window.
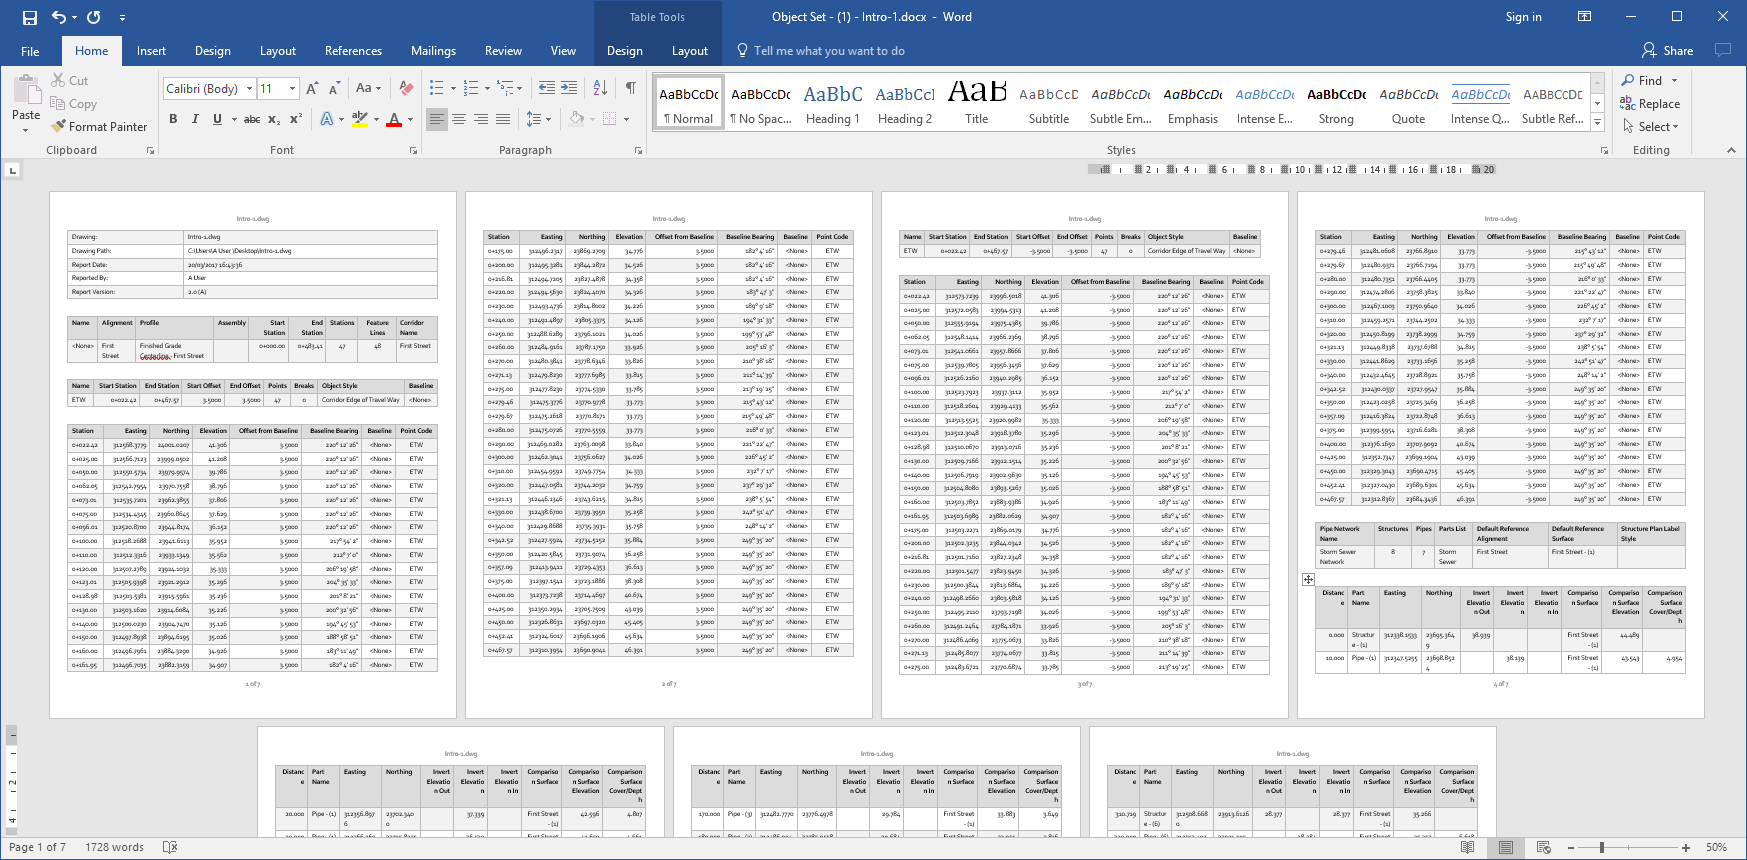
- The report is generated. Open Microsoft Word to inspect the resulting report file. Note the inclusion of the ETW feature lines from the First Street corridor and the pipe run from the Storm Sewer Network pipe network.
Duplicating an Object Set
We would like to use Object Sets to generate this report to two different file formats simultaneously. We can achieve this by duplicating this object set, and making a few edits to the duplicate.
- In the Object Sets tab of the main ProjectExplorer window, right click our existing object set and select Copy from the right-click menu.
- Right-click again and select Paste from the menu. We now have two identical object sets containing the same objects and filters.
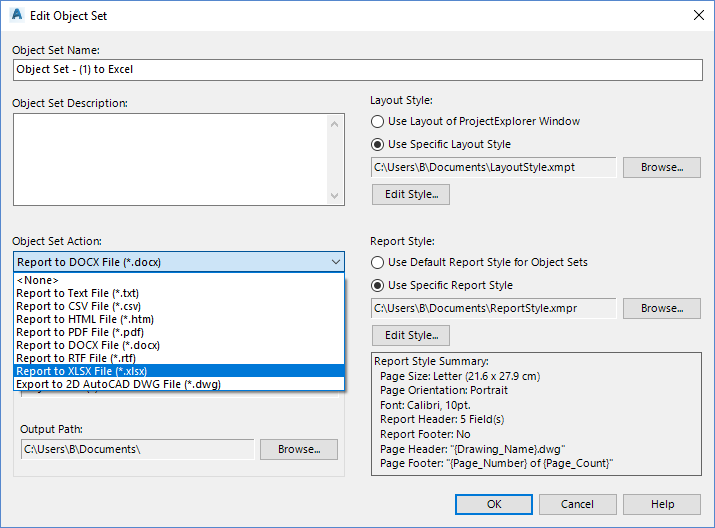
- Double-click the new object set to open the Edit Object Set dialog, then change the Action to Report to XLSX File.
- Change the Object Set name from Object Set - (1) - Copy to Object Set - (1) to Excel.
- Click OK to close the Edit Object Set dialog and return to the main ProjectExplorer window.
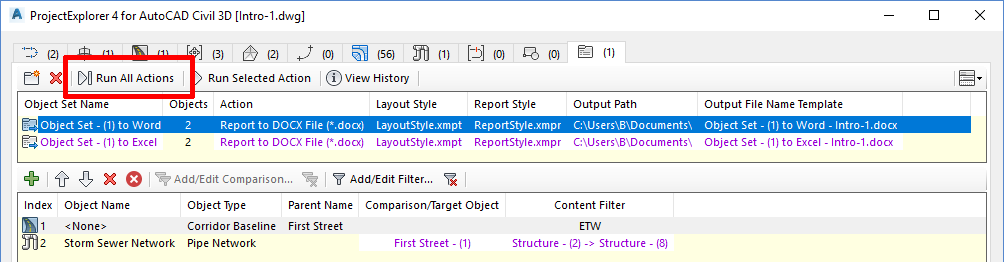
- Use the same technique to change the name of the first object set to Object Set - (1) to Word.
- We have now defined two Object Sets which are identical apart from the file type of the generated report.
- Press the Run All Actions button in the main toolbar. Actions are processed from all object sets in the drawing, which in this case will cause our report to simultaneously be written to a DOCX file and an XLSX file. Review the resulting files in Microsoft Word and Microsoft Excel.
Here is the resulting file as it looks in Microsoft Excel, with each object in the Object Set written to a separate worksheet:
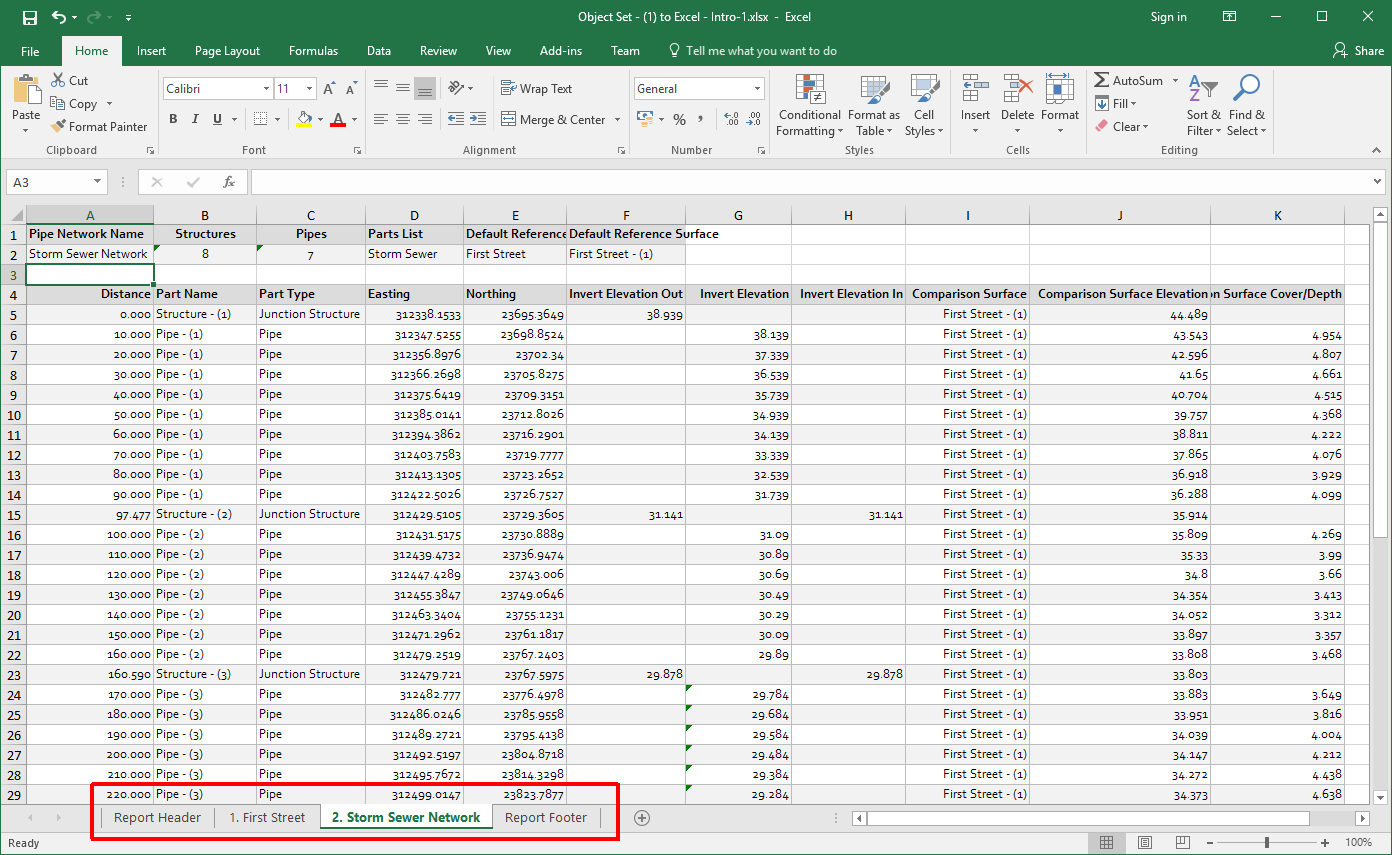
To prevent the report header and footer from creating additional worksheets in the exported file, deselect the Report Header and Report Footer options in the referenced Report Style and select Run All Actions again.
ProjectExplorer does not automatically set the width of columns in the exported Excel file. In Microsoft Excel, select the entire worksheet and select Autofit Column Width from the cell formatting options in the Excel ribbon.
The object sets that we've created in this tutorial currently share the same layout style and report style. This may or may not be preferable depending on how each report needs to be laid out. But in this case, it's worth being aware that making changes to those styles will affect the layout or style of the reports when they are next regenerated.
Save the current AutoCAD drawing. You have now completed this tutorial.
What's Next?
Now that we have successfully configured two Object Sets in our drawing, both reports can be regenerated at any time simply by selecting Run All Actions in the ProjectExplorer window.
A few things you could try:
- Try applying some design changes to your Civil 3D model then regenerate the reports to review the effect of those design changes.
- Try reconfiguring the data columns in these reports by editing the Layout Style which is associated with the two object sets. Regenerate the reports to review the effect of these changes.
- Try changing the style of these reports by editing the Report Style which is associated with the two Object Sets. Regenerate the reports to review the effect of these changes.
In the next tutorial we'll use the editing capabilities of ProjectExplorer to modify the pipe network and corridor referenced in these reports, then we'll use the Run All Actions option to instantly update both reports.